Jennifer Taylor
I spent over a decade as a developer, coding financial and business software. I have a bachelor's degree in computer science and multiple certifications (most recently related to data analysis). After a break from coding to spend some time writing, I'm ready to take on a new challenge: data analysis. I find this closely relates to my favorite parts of the projects I worked as a developer. Data analysis is exactly where I need to be.
Please contact me or view my linkedin profile with the links below. Thank you!
coderjen@gmail.com linkedin.com/in/jenniert/ My Current Resume

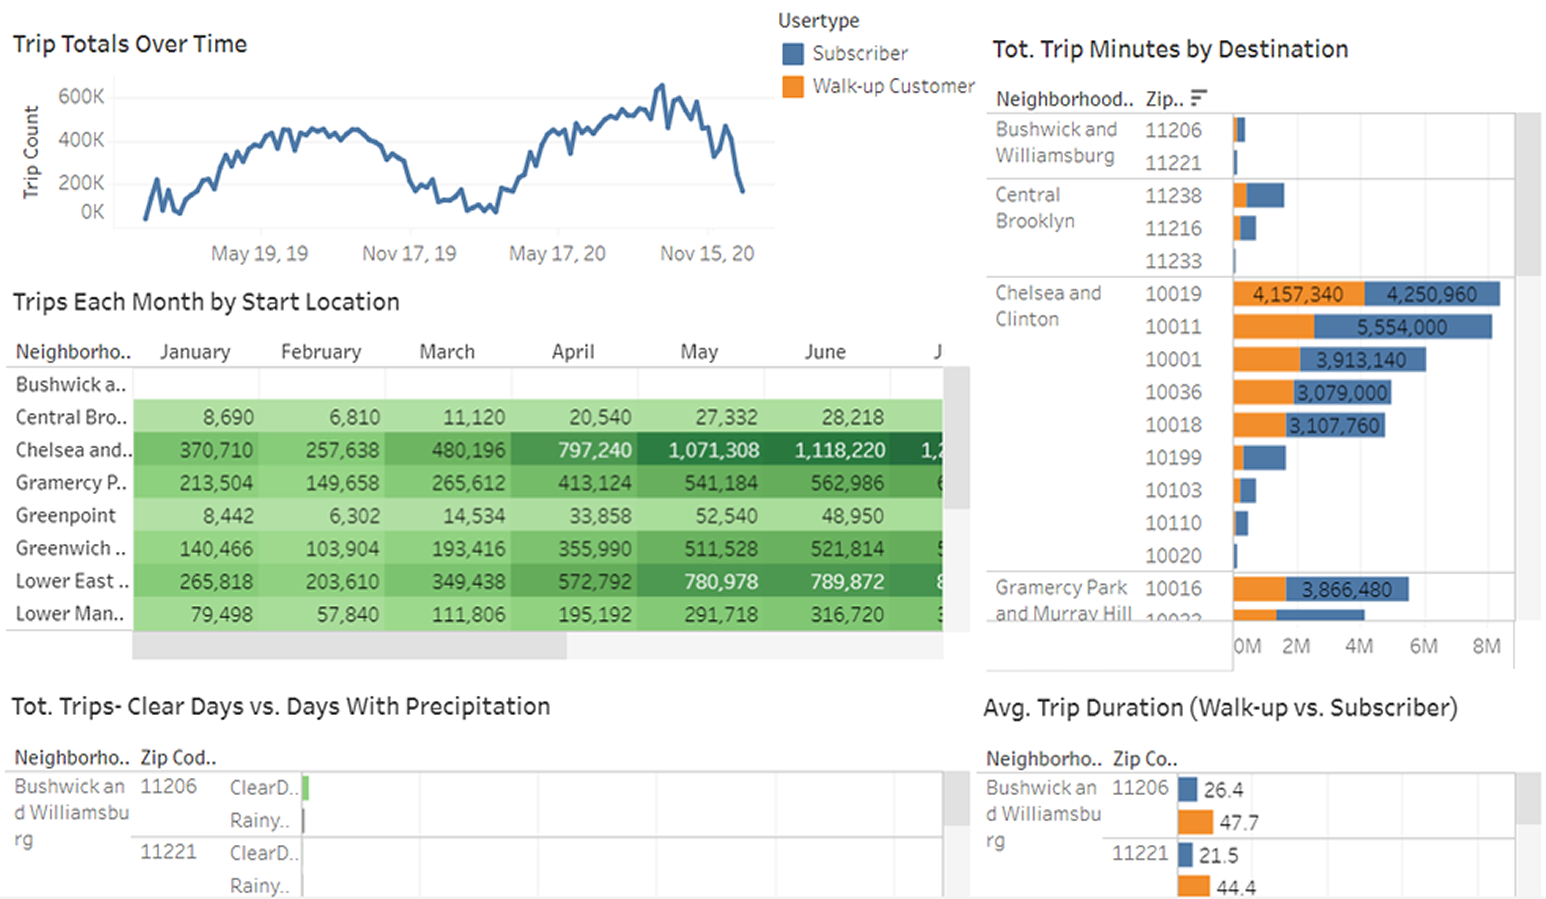
Cyclistic Bike Share Project
This project uses Tableau to analyze traffic for the Cyclistic bike share company.
This was a project for my Google Business Intelligence certification class. I obtained data with BigQuery and exported it into .csv files for use with Tableau.

Google Fiber Call Center Project
This project uses Tableau to analyze support calls for the Google Fiber call center team.
This was a project for my Google Business Intelligence certification class. I used BigQuery to join the provided data and select only the applicable portion before exporting it into .csv files for use with Tableau.
Minnesota Interstate Highway Traffic Project
This project uses Tableau to analyze traffic for the Minnesota Dept. of Transportaion.
This was a project for my Google Business Intelligence certification class. I was provided with a .csv with traffic data to use with Tableau.
Star Wars Movie Ratings
This project uses Python and Tableau to look into how fans and critics rated each Star Wars movie.
I scraped data from Rotten Tomatoes and used Tableau to manipulate and analyze the data.
Kansas Crime 2021
This project uses Power BI to look into Kansas crime.
I scraped data from the web, performed extensive data cleanup and manipulation, and combined tables to create the data for this project.
Star Wars Jedi
This project uses Python to look into various factors involving the Jedi from Star Wars.
I coded this in VSCode using Python, the NumPy, Pandas, and Matplotlib libraries, as well as the urllib, and re modules.
Workplace Injuries & Deaths
This project uses Power BI to look into workplace injuries and deaths across the United States.
I downloaded data for import into Power BI, combined tables, manipulated, and cleaned the data.
Airbnb Analysis
This project uses Excel pivot tables to look at data from a survey of Airbnb. This was a project for a class I took.
The data for this project came from a class I took on analysis.I clean and manipulated the data, then used pivot tables to analyze the results.